Traders can use Deriv RSI indicator in real-time, allowing them to make quick decisions based on market conditions. By studying the RSI’s important thresholds and patterns, traders can spot prospective trends, divergences, and price reversals.
In this piece, we provide an in-depth examination of RSI, how it can be used on Deriv, and various other elements that could help traders in this guide.
What is RSI, and How is it Interpreted?
The Relative Strength Index (RSI) is a technical analysis tool traders and analysts use to quantify the velocity and speed of a security’s price moves.
The RSI is a momentum oscillator with a scale of 0 to 100. It is often used to identify overbought or oversold market circumstances, allowing traders to make more educated decisions.
When the RSI rises above 70, it is deemed overbought, indicating it is time to sell. When the RSI falls below 30, it is considered oversold, indicating a potential buying opportunity.
Traders often look for a move over or below the 50-day moving average, distinguishing between bullish (above 50) and bearish (below 50) market circumstances.
How to Select and Use RSI on Deriv Platforms
The Relative Strength Index (RSI) holds significant value as a technical analysis tool that seamlessly harmonizes with Deriv trading platforms.
With its user-friendly interface, utilizing the RSI in your trades becomes incredibly uncomplicated on Deriv. Below, we will carefully go through each step of the procedure together.
Step 1: Log in to your Deriv account.
Begin by logging into your Deriv account. Depending on your option, you can accomplish this via the Deriv website or the mobile application. To avoid interruptions in your trading activity, ensure a stable internet connection.
Step 2: Select your desired market and chart.
Once logged in, go to the trading portion of the platform. You can select your desired market – example Deriv Stock indices, and the individual chart to which you wish to apply the RSI. Deriv provides diverse markets and chart formats, allowing you to tailor your trading experience to your specific methods and objectives.
Step 3: Search for the ‘Indicators’ ‘ tab for ‘RSI.’
After you’ve set up your chart, you may add the RSI indicator. Locate and click on the ‘Indicators’ tab, usually at the top of the chart interface. This will provide a search bar where you can type ‘RSI’ to find the Relative Strength Index.
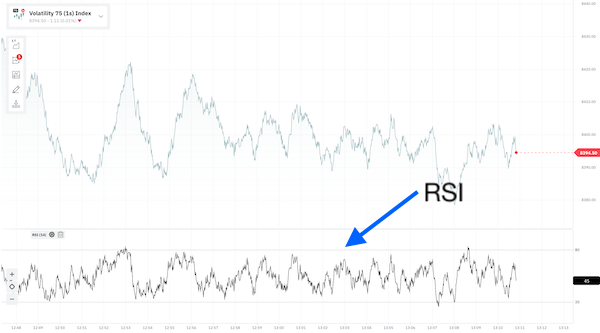
Step 4: Select ‘RSI’ to add it to your chart
If you type in ‘RSI’ on the search bar, a list of matching indicators will be shown as a dropdown menu on the platform. Choose ‘RSI’ from this list to include it in your chart for analysis. The RSI indicator will then be appended at the bottom of your chart for easy access and examination.
Trading Strategies Using RSI on Deriv Platforms
Several effective trading strategies utilize RSI on Deriv platforms.
- Basic RSI Strategy: This involves buying when RSI moves below 30 (oversold) and selling when it moves above 70 (overbought).
- RSI Divergence Strategy: This strategy focuses on situations where the price and RSI trends diverge, signalling a potential price reversal.
- RSI Swing Rejection Strategy: This strategy identifies swing rejection points—a move above or below 70 or 30, followed by a move back through these levels.
Common Mistakes to Avoid When Using RSI on Deriv Platforms
Some common mistakes traders make when using RSI on Deriv platforms include:
- Relying solely on RSI: RSI should be part of a broader technical analysis strategy, not a standalone tool.
- Ignoring Market Context: Traders should consider broader market trends and news events when interpreting RSI signals.
- Overreliance on Overbought and Oversold Levels: Traders frequently make the error of placing trades only based on RSI crossings of 70 or 30, ignoring other important factors such as market trends and volatility.
- Misreading RSI Levels: Traders should not assume that a reading above 70 or below 30 will immediately result in a market reversal. RSI can remain in overbought or oversold levels in strong trending markets.
Other DERIV Indicators and Strategies
Frequently Asked Questions
What are the best RSI settings?
The optimal setting for the Relative Strength Index (RSI) is primarily contingent upon the trading period of individuals and the prevailing market conditions. However, 14 is the default period.
Is RSI good for Stocks?
Yes, the Relative Strength Index (RSI) is a valuable analytical instrument capable of detecting potential instances of overbought and oversold market conditions.
How do I adjust the RSI settings on Deriv platforms?
The RSI parameters can be modified within the indicators tab. The default period is 14; however, you can decrease this value to enhance or increase it to reduce sensitivity, contingent upon your trading approach and the market volatility level.