
Deriv’s boom and crash indices are perfect assets to execute some simple strategies that might enhance your trading success. read more about Boom and Crash strategies for Deriv trading platform!
Introduction to Boom and Crash Indices
Deriv is a reputable and innovative platform and is currently the only broker that offers Boom and Crash Indices, two of the most volatile synthetic indices in the forex trading industry.
The “Boom” index refers to a significant spike in the market that could range between 50 to 60 pips. “Crash” is a spontaneous price breakdown between 50 and 60 pips.
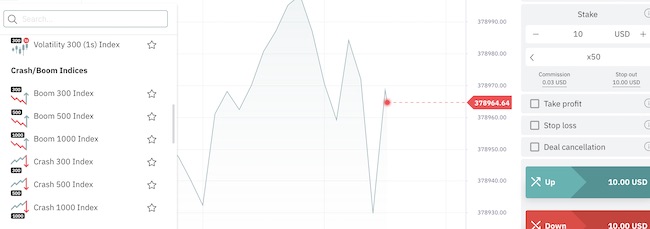
Boom and Crash indices are typically presented in six forms on the Deriv platform, namely:
- Boom 1000
- Boom 500
- Boom 300
- Crash 1000
- Crash 500
- Crash 300
Notably, neither Boom nor Crash is pegged to any currency, and they typically occur within one-minute timeframe charts. Furthermore, Boom and Crash indices are unaffected by fundamental factors, and trading depends on price action and technical factors.
Therefore, before you start trading Boom and Crash indices on Deriv, you must note the following:
- This index is popular because traders can make profits using the one-minute timeframe.
- The index does not follow pending Stop-Loss or Take-Profit orders, and a position can only be closed at the end of the spike or drop in the market.
- The position sizes allowed with trading Boom and Crash is a minimum of 0.20 lots to 50 lots. Thus, one lot size is equal to a one-dollar value. So, for instance, if you trade 10 lots, you can make or lose 10 USD for every 10-pip price movement.
The Best Indicator for a Deriv Boom and Crash Strategy
Before you trade Boom and Crash on Deriv, you must understand support and resistance levels and Price Action. These are the most important technical indicators you can use in a Boom and Crash Strategy, regardless of whether you trade Deriv Boom 1000, Crash 500, or Boom 300 Deriv.
If you are familiar with these indicators, you can easily identify the point at which the price will stop and where it is likely to change direction.
Support and Resistance
- The support level on the chart is the lowest price point, where a downtrend can be expected to pause. Once it reaches this level, it typically reverses upwards or can break through and continue downwards.
- The resistance level is the highest that a price could go before it goes back down.
To identify Support and Resistance, you can employ a myriad of technical indicators, including moving averages, Bollinger bands, and trendlines.
Price Action
Understanding price action is essential to trade boom and crash effectively. Identifying bullish and bearish patterns requires the analysis of candlestick movements, sketching support and resistance levels, and zones of demand and supply.
With your preferred indicators and identifying patterns and trends over several timeframes, you can easily establish the optimal entry and exit positions for a trade.
Candlesticks are the most popular price action indicator because they provide traders with valuable information, such as the opening and closing prices of a market and the high and lower price levels over a user-defined timeframe.
Deriv Boom and Crash Strategies
Creating a well-formulated trading strategy is necessary for trading Boom and Crash indices on Deriv.
When trading the boom and crash indices, you must remember that the same trading concepts hold true regardless of whether you trade Boom 300 Deriv, Boom 1000, Crash 300 Deriv, etc.
Furthermore, the strategy you choose will depend on several factors, including:
- Trading experience and knowledge
- Unique Trading Styles
- Risk Appetite
- Market Exposure
- Trading Psychology
Demand and Supply Zones
A Demand Zone is a level at which most traders are willing to purchase the asset. In contrast, a Supply Zone is a level at which many traders are ready to sell the asset.
Supply and Demand zones can be employed with Boom and Crash for medium- or long-term positions. Moreover, a succession of spikes can be anticipated from the levels.
Like a strong support level, a demand zone is where the price is most likely to be refused. To use these zones, you can:
- Create your chart
- Mark the demand zone and place your purchase.
- Place a stop-loss order depending on your equity and trading strategy, ideally 10 to 20 points underneath the demand zone.
Furthermore, you can use the supply zone in crash indices when a price decline is anticipated by highlighting the supply zone and maintaining one of the positions to maximize your trade’s profitability.
Deriv Boom and Crash Strategy for Beginners
Beginners can easily start trading the Boom and Crash Index on Deriv using a risk-free demo account strategy. The demo account is funded with virtual money that allows you to trade freely without risking your capital.
The Deriv demo account gives you access to live market conditions, comprehensive charting, and advanced trading tools to develop and refine the ideal strategy before you enter live trades where your money is at risk.
Boom and Crash Spike Strategy Explained
In terms of Crash, traders can start buying upwards. Once a spike occurs, traders can try to buy again and expect a spike to occur immediately or after a short while, depending on the market’s direction.
In terms of Boom, traders can sell downwards, wait for the spike, and sell again. Next, the spike will occur immediately or appear after a time, depending on the market’s direction.
The best way to catch the spikes with the Boom and Crash index is to employ the Relative Strength Index (RSI), and traders can easily use this by setting up their levels as follows:
- Use a demo account and insert a 200 EMA onto the chart.
- Evaluate D1, H4, H1, M30, M15, and M5 to identify any hot zones.
- Draw the line at each zone and place a sell limit on each point.
- Use the chart to familiarize yourself with the overall market trend.
- With a downtrend on Crash, traders will find that M15, M5, and M1 hot zones are suitable, while H4, H1, M30, and even D1 are ideal for upward trends.
- When trading Boom, M15, M5, and M1 hot zones are ideal for upwards trends, while H4, H1, and M30 are more suitable during downtrends.
Catch Boom and Crash Spikes with Ichimoku Cloud
Applying the Ichimoku cloud indicator to a chart will immediately show you where the support and resistance levels are. Follow these steps to use this strategy:
- Insert the Ichimoku Cloud indicator by selecting it in the indicators panel.
- Wait for the price to reach an Ichimoku support level (in the Boom Indices) or an Ichimoku resistance level (In Crash Indices).
- Suppose the price is getting close to a Support or Resistance level. In that case, you should try to make a profit by selling at the peak of the spike and placing your stop-loss order below the level.
- Remember that rejections typically occur from the exact level, so you should not risk losing money by being careless with your stop-loss here, especially on longer timeframes.
- Suppose the price is unable to be rejected by the support or resistance level. In that case, traders could see a prolonged period of strong price action without any significant price fluctuations.
1-Minute Deriv Boom and Crash Strategy
Scalpers often use one-minute strategies to profit from small market price movements. Scalping is an advanced and highly risky strategy that relies on large position sizes, small price movements, and attention to detail on charts.
The one-minute Deriv Boom and Crash strategy relies heavily on Moving Averages and Stochastic Oscillators to identify ideal opening positions. Because Boom and Crash rely heavily on price action, traders must be familiar with technical analysis.
Moving Averages
Moving Averages map out price movements in the market by updating the average price in real-time. This indicator shows the filtered market direction, allowing the trader to see the market direction clearly.
When there is an upward trend, the moving average is angled up. In contrast, the moving average is angled down during a downward trend.
Stochastic Oscillator
A Stochastic Oscillator compares the closing prices in the market to its price range over a certain timeframe.
The Stochastic Oscillator ranges from 0 to 100. When the indicator is between 80 to 100, it indicates that the market is overbought. At the same time, levels between 20 and 0 show that the market is oversold.
Should the indicator go above 80, it shows aggressive sellers and signals that traders should “sell,” while levels below 20 signal a “buy” as buyers attempt to reverse the trend.
Now that you understand the role that Moving Averages and Stochastic Oscillator play, you can set up your 1-minute Boom and Crash strategy by following these steps:
- Open a candlestick chart.
- If there is a clear trend, confirm the trend using H4, H1, and M30. Furthermore, ensure that there is a consistent market trend.
- Use the Stochastic Oscillator to identify that the market is overbought.
- Use Period 10 Moving Average (MA) and Period 7 Exponential Moving Average (EMA).
- Make sure that the 7-Period MA crosses below the 10-Period EMA.
- The full candle must close below the two moving averages, confirming the downward trend.
- Count ten candles and take your profit.
FAQ
Does Deriv have boom and crash?
Deriv is currently the only broker that offers Boom and Crash indices.
What is the best strategy for trading boom and crash?
One of the best strategies for boom and crash on Deriv is the 1-minute strategy that relies on Moving Averages and Stochastic Oscillators to identify the ideal entry point.
Which indicators are the best for boom and crash?
RSI, Moving Averages, and Stochastic Oscillators are the best indicators for an effective boom and crash trading strategy.
Can I trade boom and crash with 10 USD?
You can trade the boom and crash index using 10 USD, as Deriv only requires a minimum deposit of 5 USD to register an account.
What is the best time to trade Boom and Crash on Deriv?
The best time to trade Boom and Crash is when the London and New York sessions overlap. During this time, the volatility and liquidity in the market are at their highest, allowing scalpers to profit from many small price movements.
Your capital is at risk